Turning a four-hour decision into a fifteen-minute one
Client
Unlocking millions in hospital savings
Year
2022
Hospitals were losing millions to a decision that took four hours and five disconnected systems.
I led the design of a decision tool that turned a fragmented, manual supply-chain process into a lean, data-driven one, cutting decision time from four hours to fifteen minutes.
Sensitive data censored due to NDA.
Scope of Work
01 Context
Hospitals manage enormous, high-stakes supply-chain spend, and they were doing it on fragmented, manual processes. Administrators, doctors, and procurement teams each held a piece of the picture, in different systems, with no shared view. I led design end to end with a six-person delivery team.
02 Problem
The challenge
Supply-chain decisions were slow and expensive. Reports were scattered across multiple systems, and consolidating them by hand took 4+ hours a day, which delayed decisions and led to costly miscalculations.
Why it mattered
Hospitals were losing millions to inefficient decisions, and stakeholders had no clear, actionable view to drive cost savings. The business problem and the user problem were the same problem: nobody could see enough, fast enough, to decide well.
How I knew it was the right problem
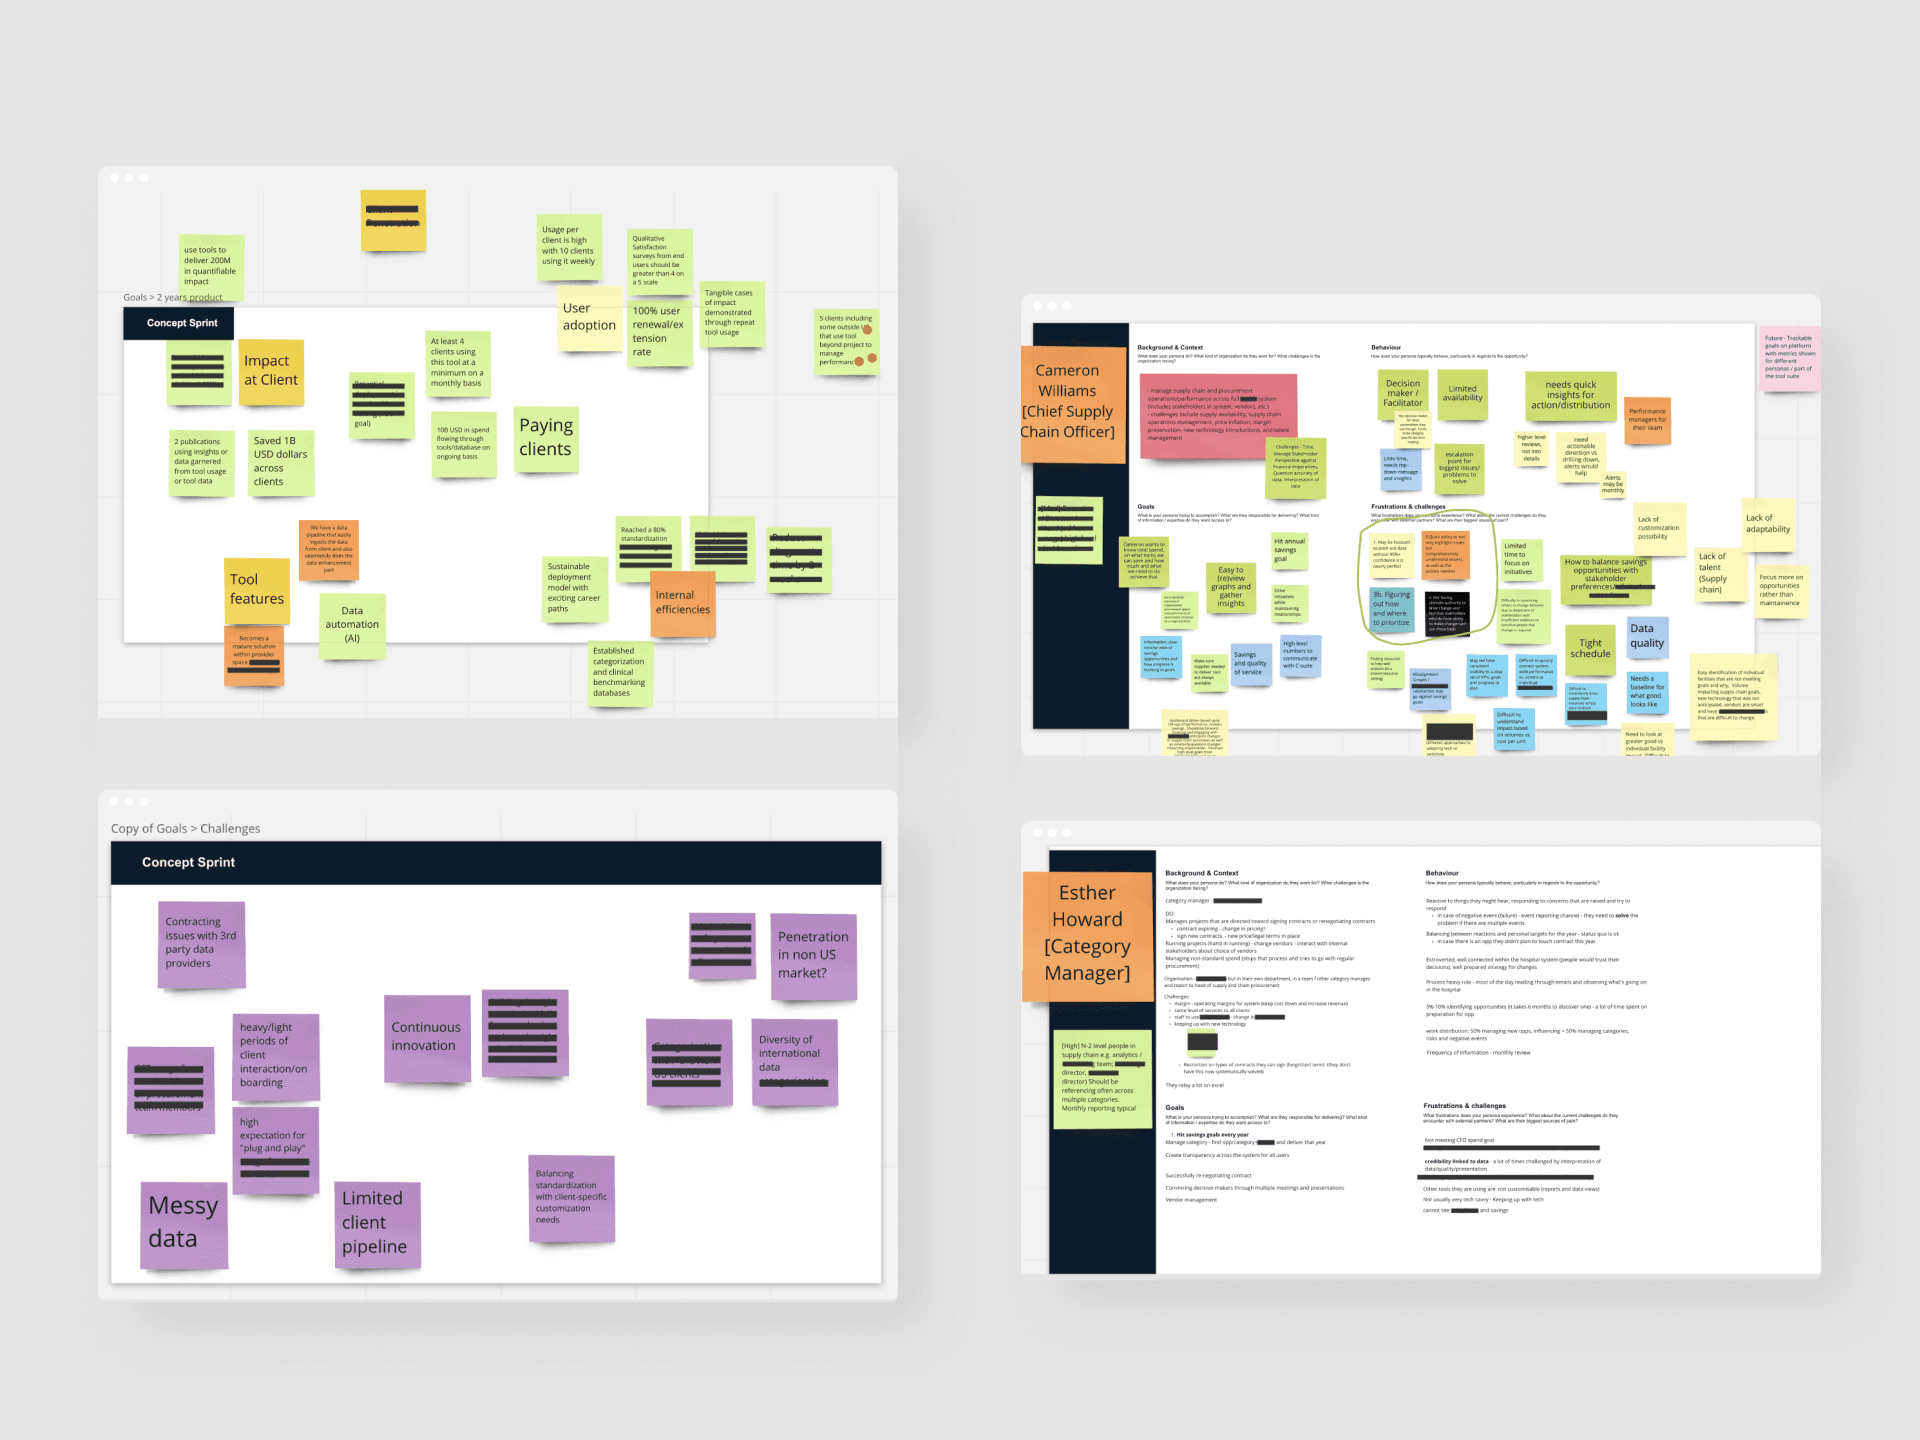
I ran stakeholder interviews across the three groups. The recurring, quantified pain was the 4+ hours a day spent consolidating reports before anyone could even make a call. That was the bottleneck worth removing.
03 Impact
50% faster decisions. Manual reporting time dropped from four hours to fifteen minutes.
Millions in projected savings. Automated detection surfaced inefficiencies the manual process never caught. Projected, not yet booked, and labeled that way.
90% stakeholder preference. Nine in ten preferred the new system over the old reporting, which is what drove adoption.
The speed gain and the preference rate were measured during the engagement. The savings figure is a projection from the inefficiencies the tool surfaced, so I label it projected rather than booked.
04 Solution
So I made the call:
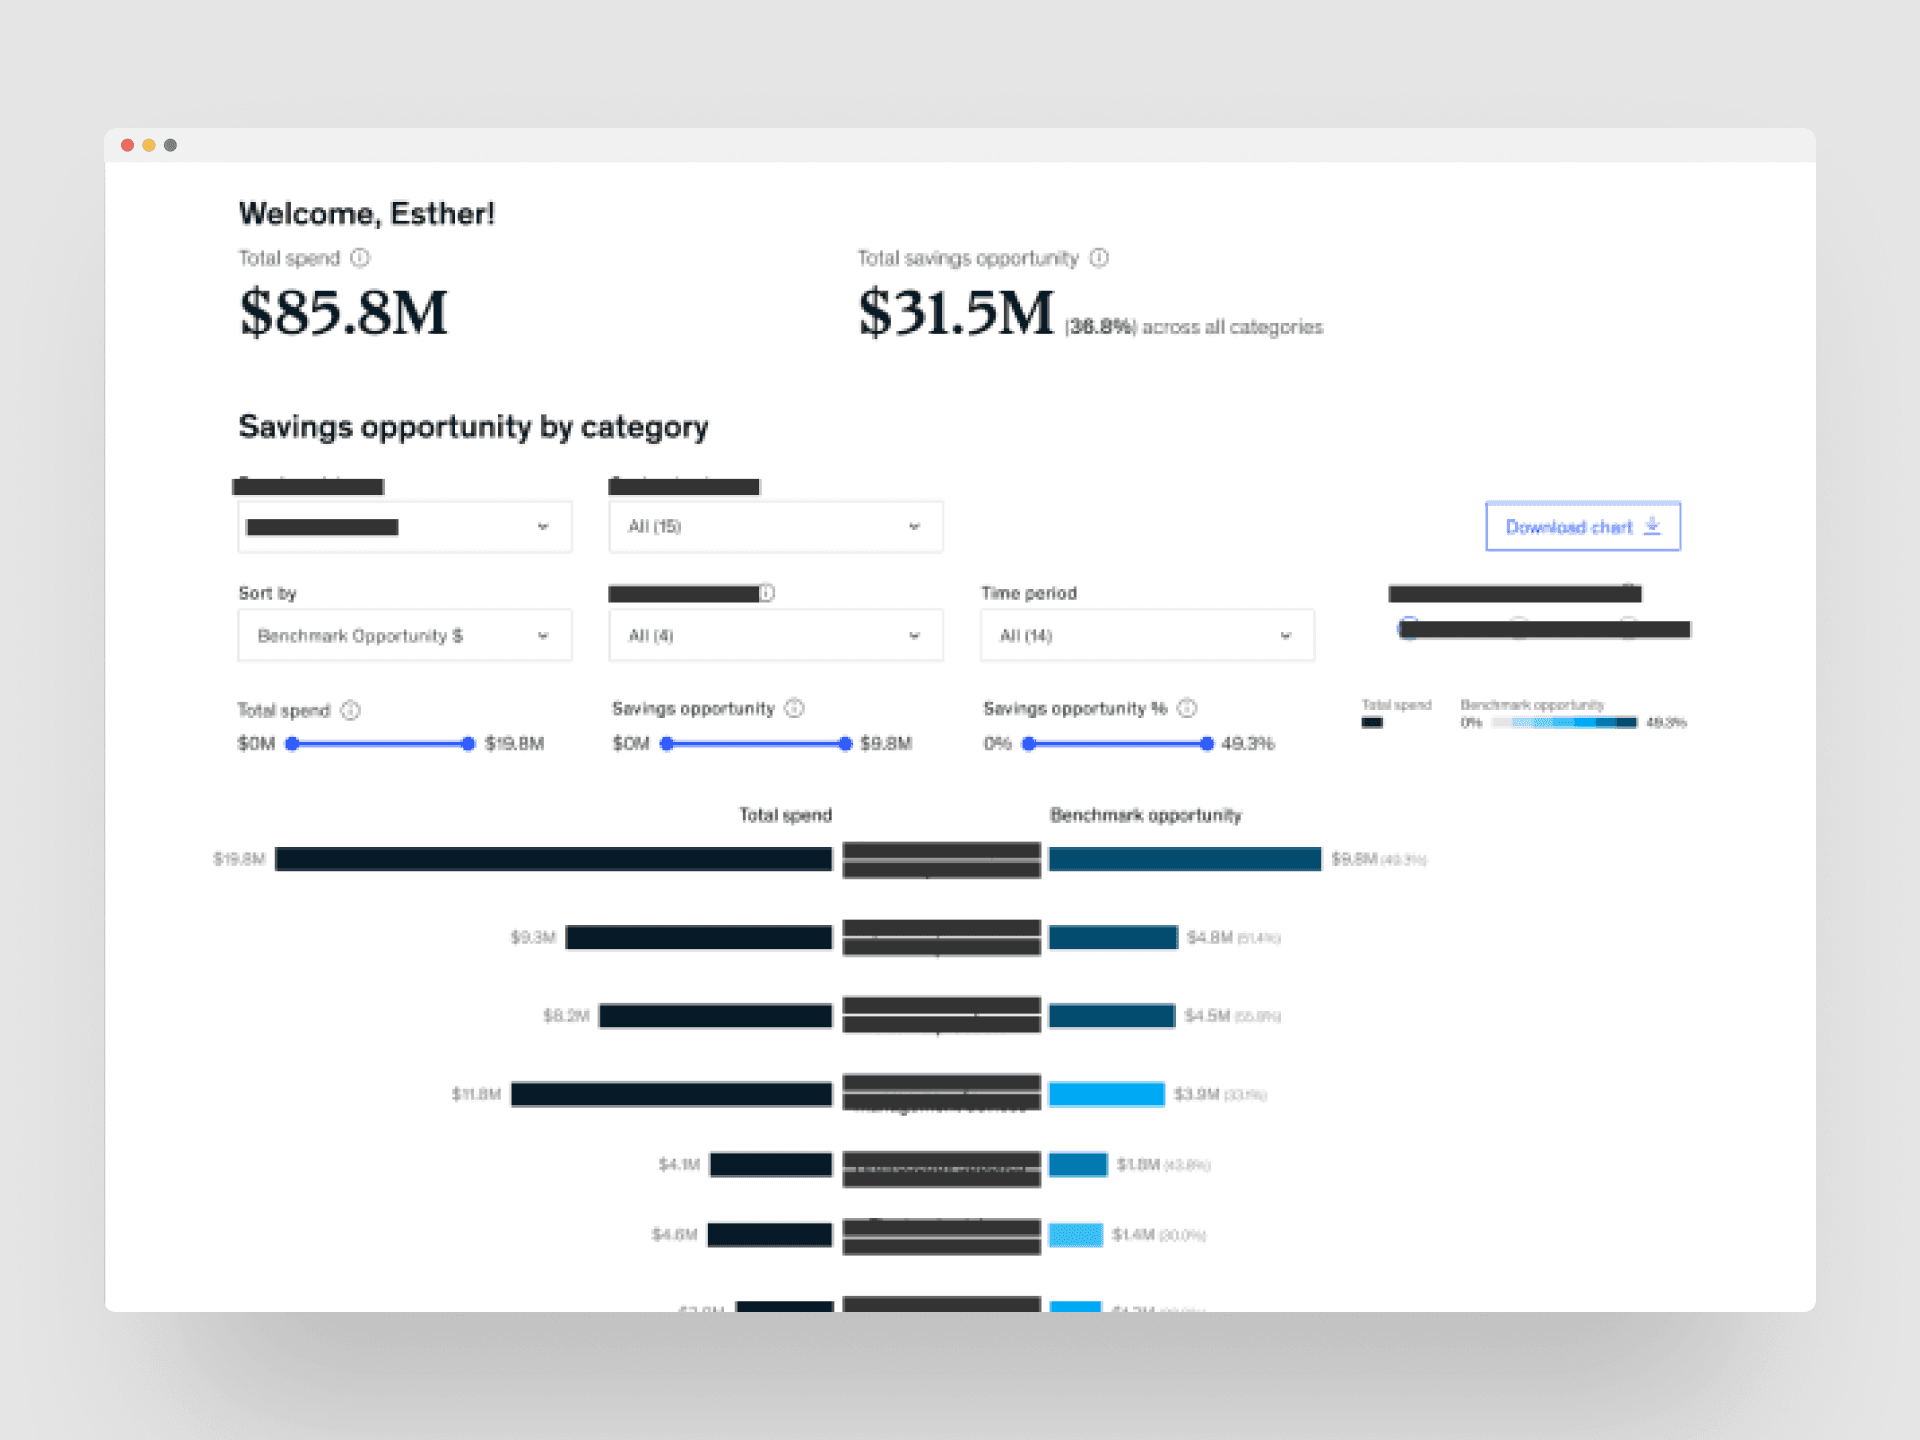
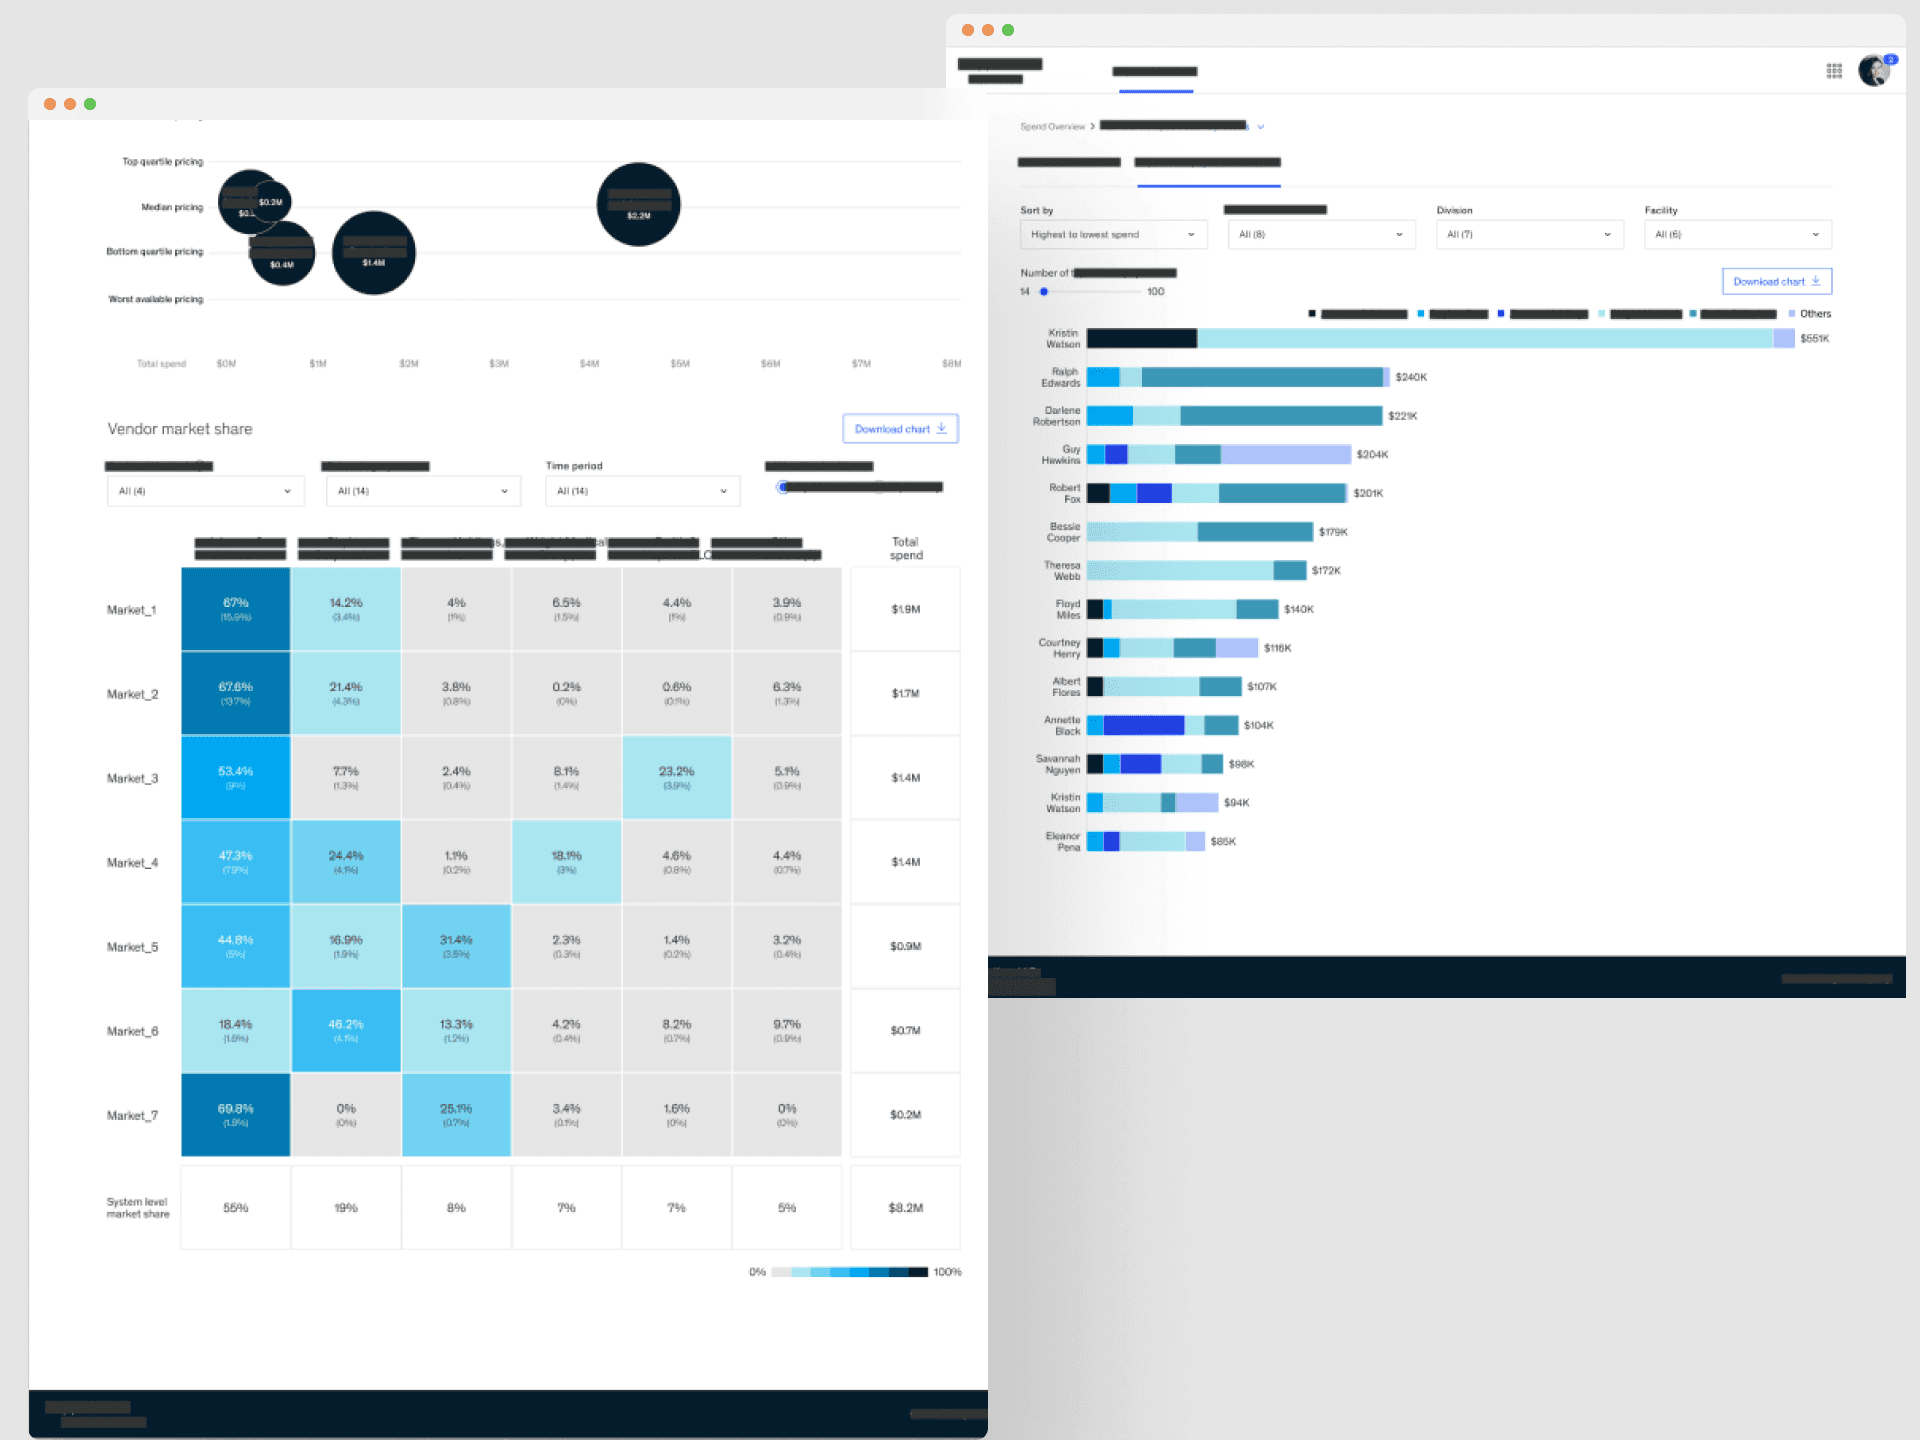
A lean MVP focused on three workflows: automated cost analysis, real-time dashboards, and collaborative decision flows, instead of trying to fix everything at once.
In practice, that is a tool that consolidates scattered data into clear, digestible dashboards, flags inefficiencies automatically, and lets admins, doctors, and procurement collaborate in one place.
05 Approach
What I owned
Stakeholder and user interviews, workshops, personas, journey mapping, executive presentations, and the design from mockups through prototypes to final specs.
How I worked
I validated before building wide. Usability tests with hospital administrators and procurement specialists shaped the tool before full implementation, which is where the design got its real shape.
A trade-off I had to navigate
Stakeholders arrived with ambitious timelines detached from real user pain. Aligning their wishes with what users actually needed, without losing their buy-in, was as much of the job as the interface itself.
06 Execution
Three things came out of usability testing and shaped the final tool:
Simplicity over completeness. Decision-makers needed clear, digestible insight, not dense charts.
Granularity by role. Different stakeholders needed different levels of detail, so the same data flexed per role.
Explainable automation. Users distrusted AI-driven analytics, so I made the models explain their reasoning, which is what earned their trust.
07 Reflection
What worked
Strategic MVP scoping. Focusing on the highest-impact workflows first is what made a fast, measurable result possible instead of a slow, sprawling one.
What I'd do differently
Push to convert the projected savings into booked, tracked numbers post-launch. The speed and preference metrics were measured; the savings would have been even stronger as a confirmed figure.
Transferable insight
When users distrust automation, explainability is not a nice-to-have, it is the adoption strategy. Data should empower decision-makers, not overwhelm them.